Good morning. This week’s write-up is going to be short. I will be spending time on different formats for future write-ups. Here are a few charts and calendars to keep you up to speed.
Review
Preview
Word of the week:
Federal funds rate- The federal funds rate refers to the interest rate that banks charge other banks for lending them money from their reserve balances on an overnight basis.
KEY TAKEWAYS
A committee of the Federal Reserve sets a target federal funds rate eight times a year, based on prevailing economic conditions. This is known as the FOMC.
The federal funds rate can influence short-term rates on consumer loans and credit cards.
Investors also pay attention to the federal funds rate because a rise or fall in rates can sway the stock market.
Currently the federal funds rate is at 2.25%
Please send me any comments, questions, or criticisms. As always, thank you for reading.
Good evening and Happy Labor Day. Thanks for joining me in preparation for the week and month ahead. Tomorrow opens the first day of trading in the month of September. According to the Stock Trader’s Almanac, since 1950, September has been the worst month for all three major stock indices(Dow, S&P, and Nasdaq), and even worse in years preceding presidential elections. Take this statistic with a grain of salt because past performance is not indicative of future results.
REVIEW
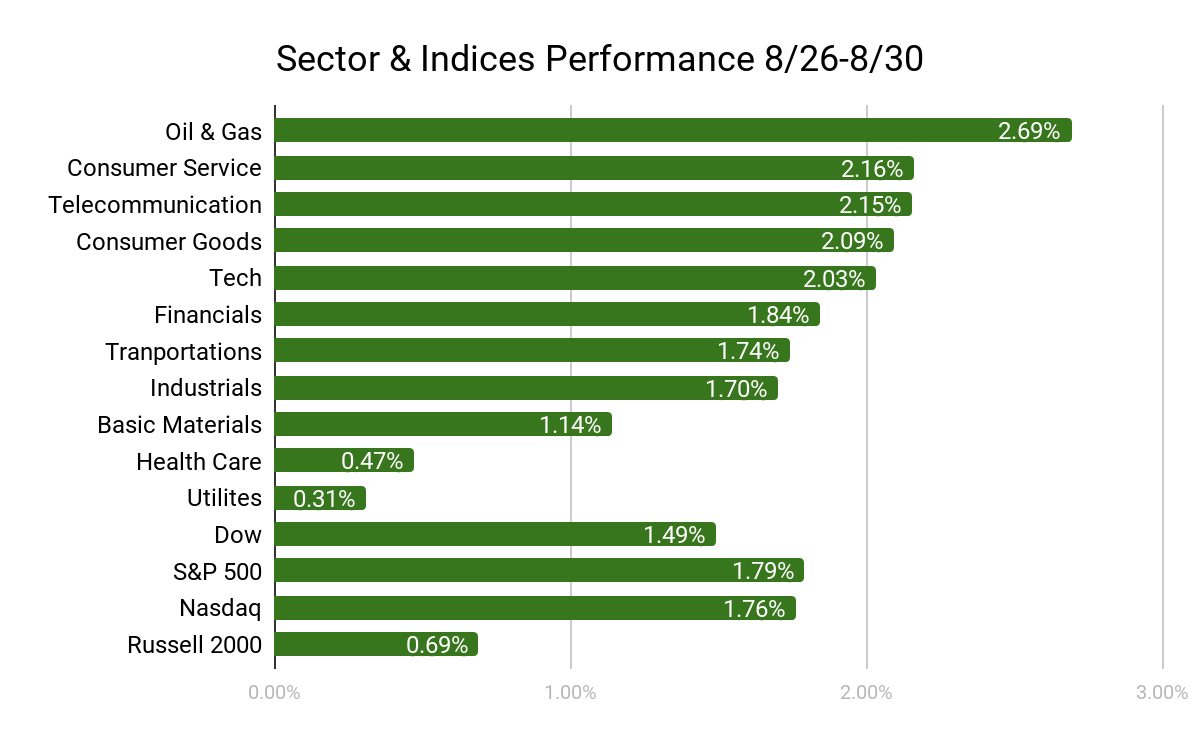
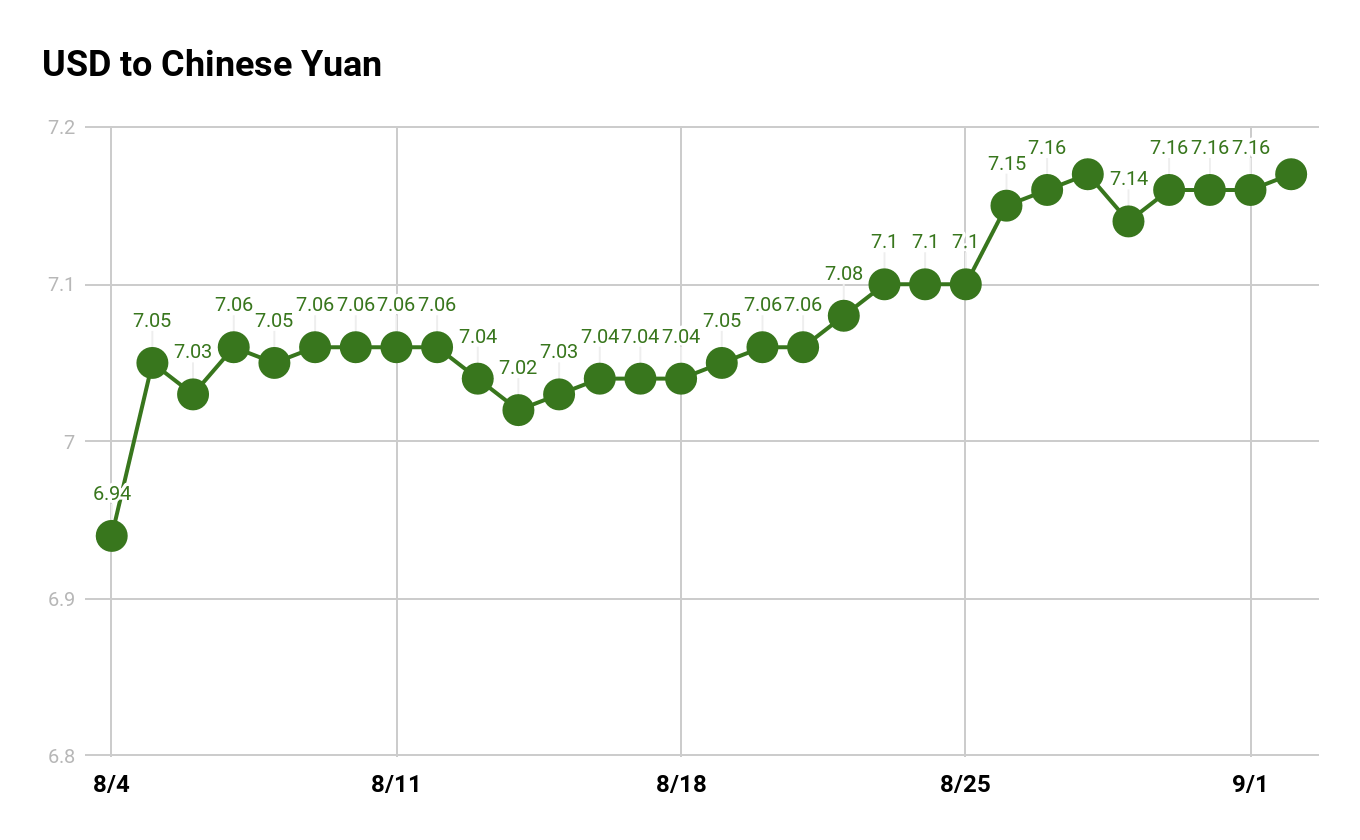
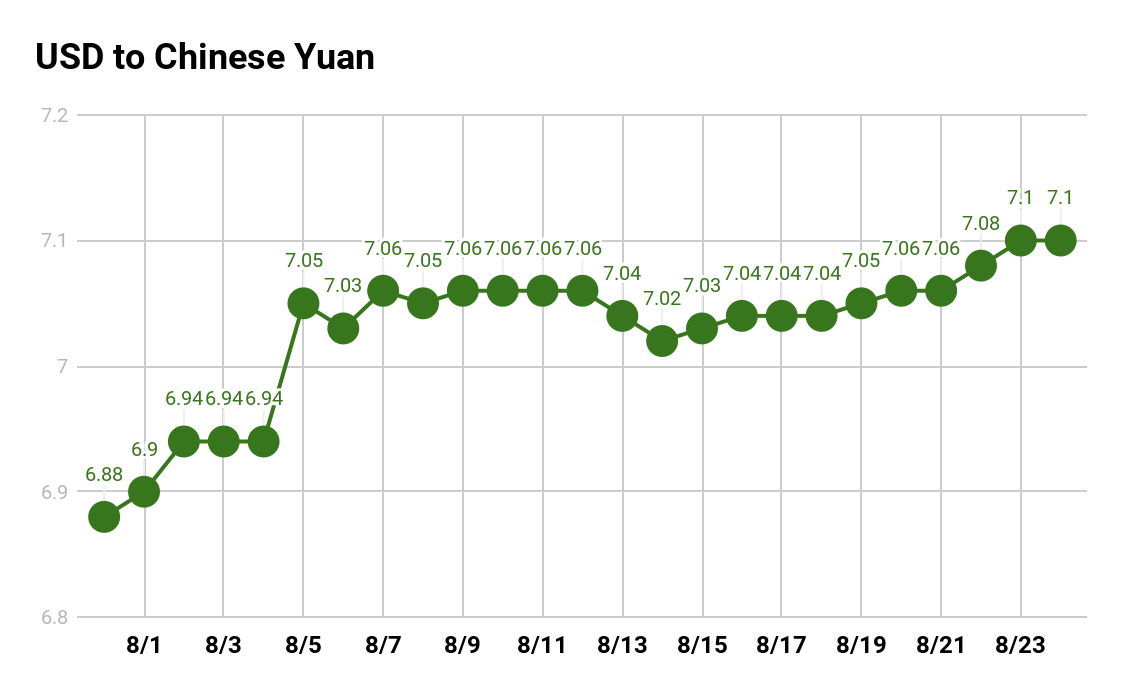
The final week of August helped recover much of the losses made earlier in the month. Final 30 day returns for the major indices were: Dow at -0.31%, S&P 500 ay -0.19%, and Nasdaq at -0.51%. I have included 3 charts below. Beginning on Sunday the 25th there was another sharp rise in the U.S. dollar to Chinese yuan ratio last week. See last week’s write-up for why this is important. The next chart displays recent U.S. treasury yields. Keep in mind the yield curve is still inverted as I explained two weeks ago. Finally the last chart shows last week’s market performance.
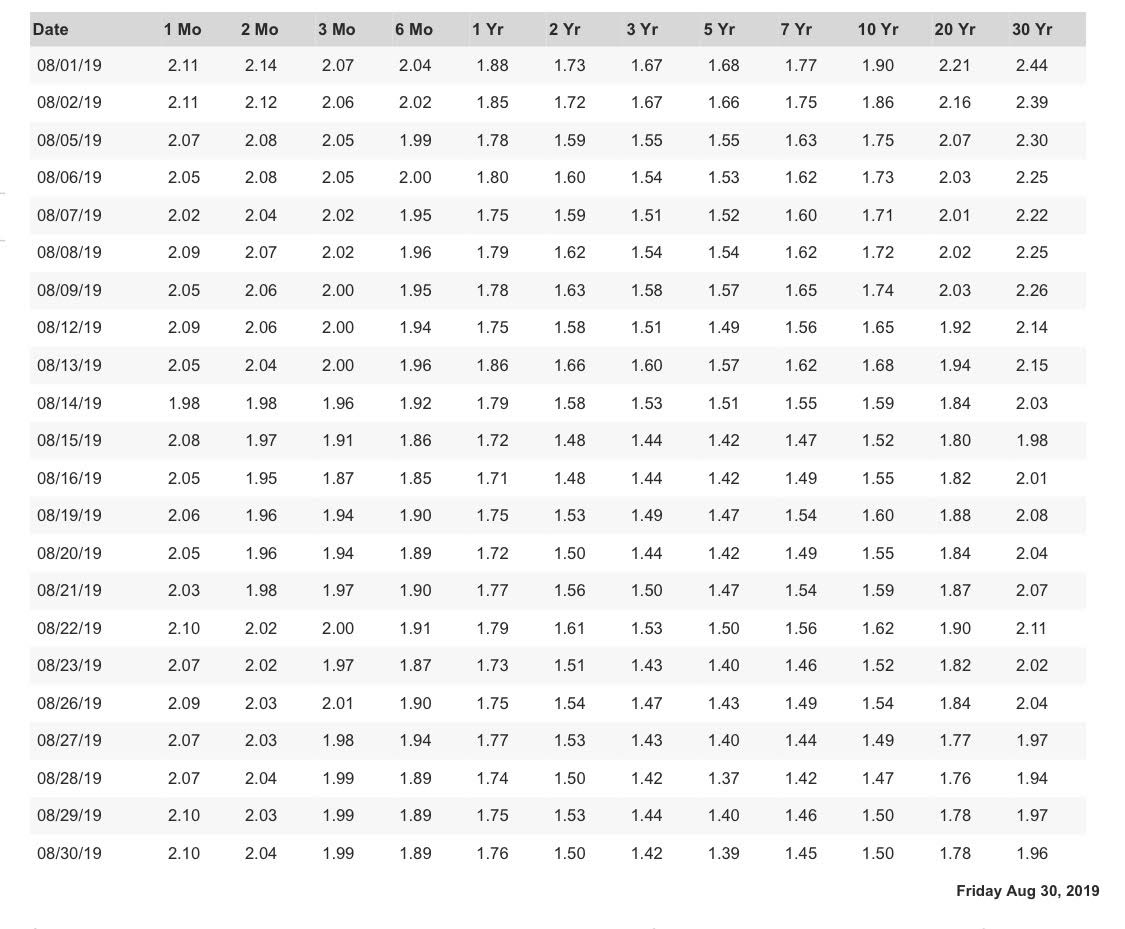
US Treasury Yields
The most important piece of data to pay attention to here is the difference between the 2 and 10 year rates. When the 2 year rate is greater than the 10 year rate, the curve is inverted.
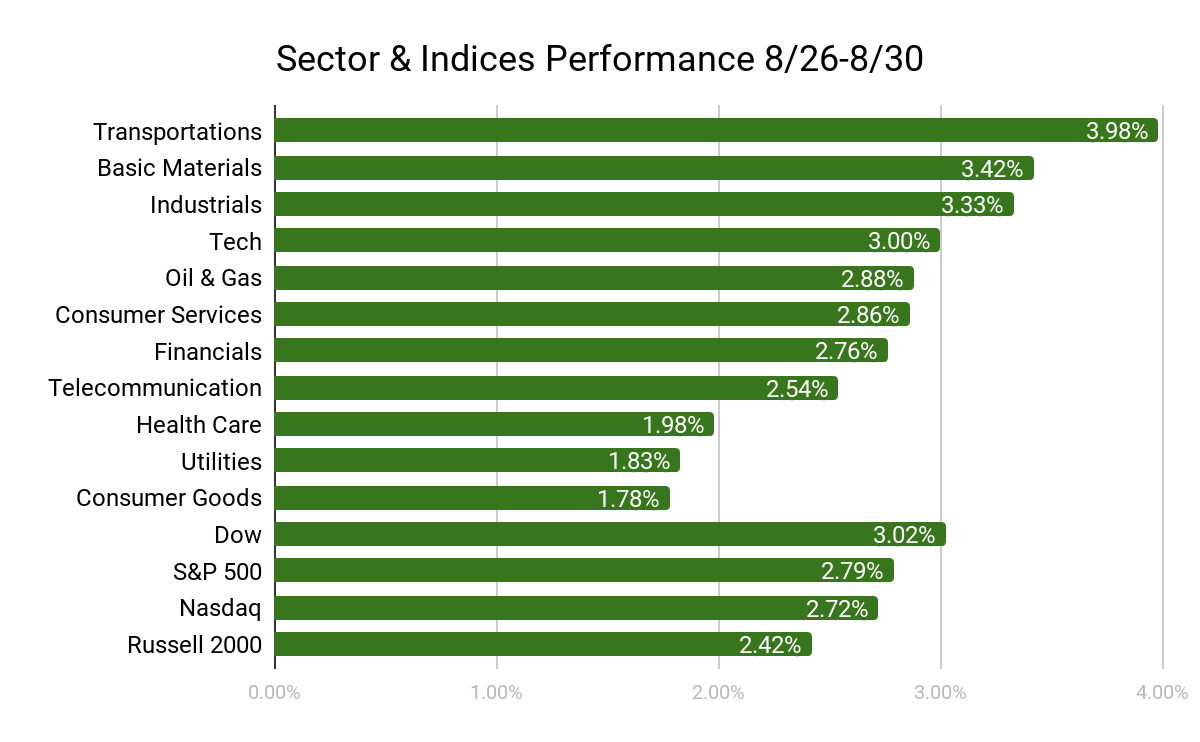
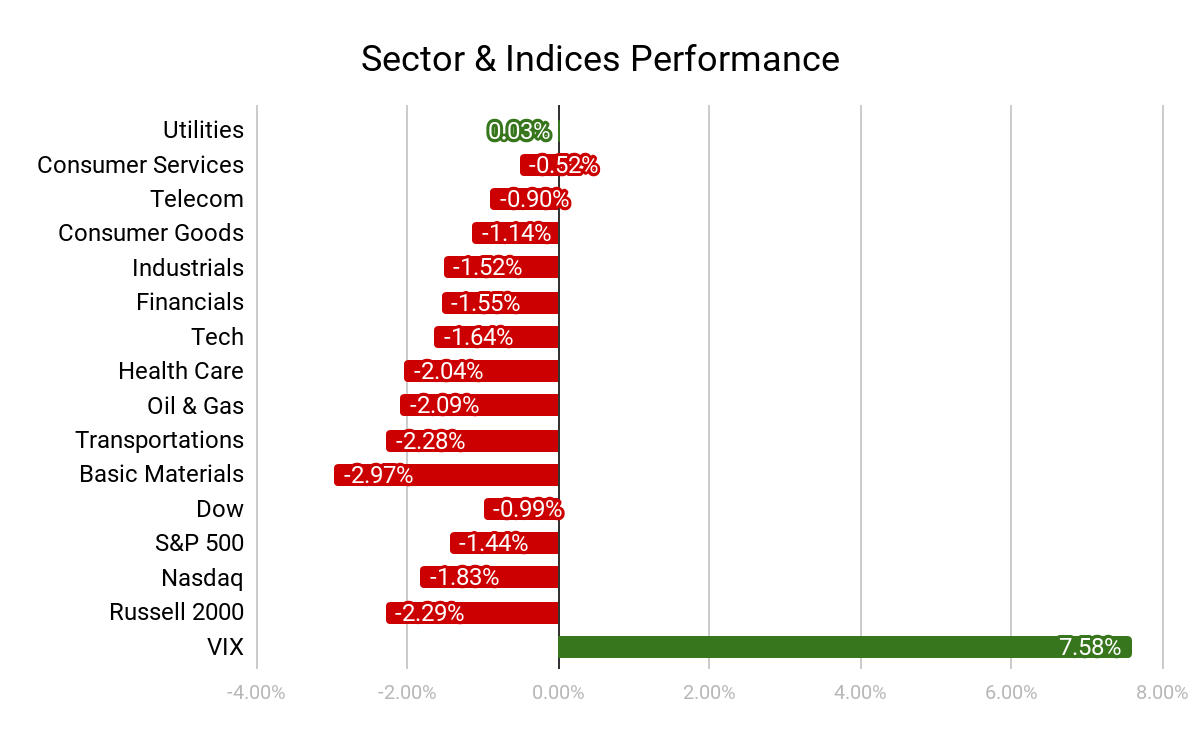
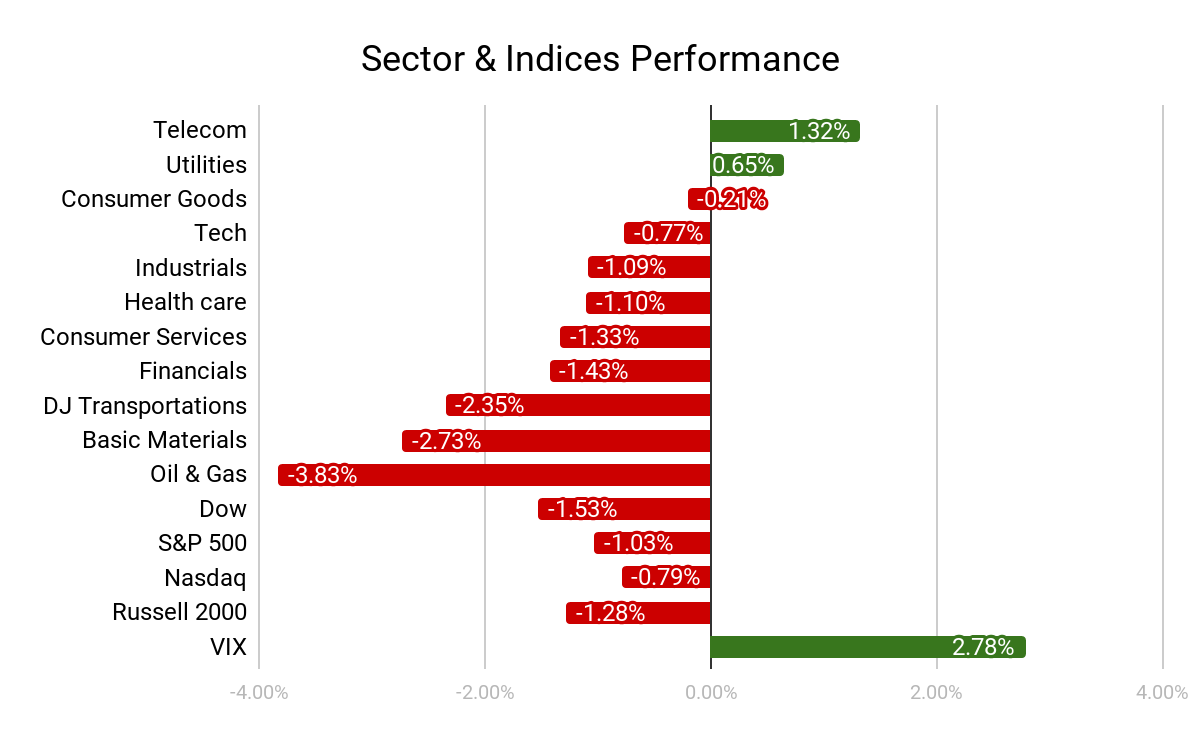
Notice the leading sector here is transportation which many analysts regard as the best gauge for the health of the economy.
PREVIEW
Yesterday more tariffs took effect on Chinese goods. These new tariffs that were scheduled to be implemented yesterday, effect over 125 billion Chinese imports. We are now currently taxing 550 billion dollars worth of Chinese imports at varying percentages.
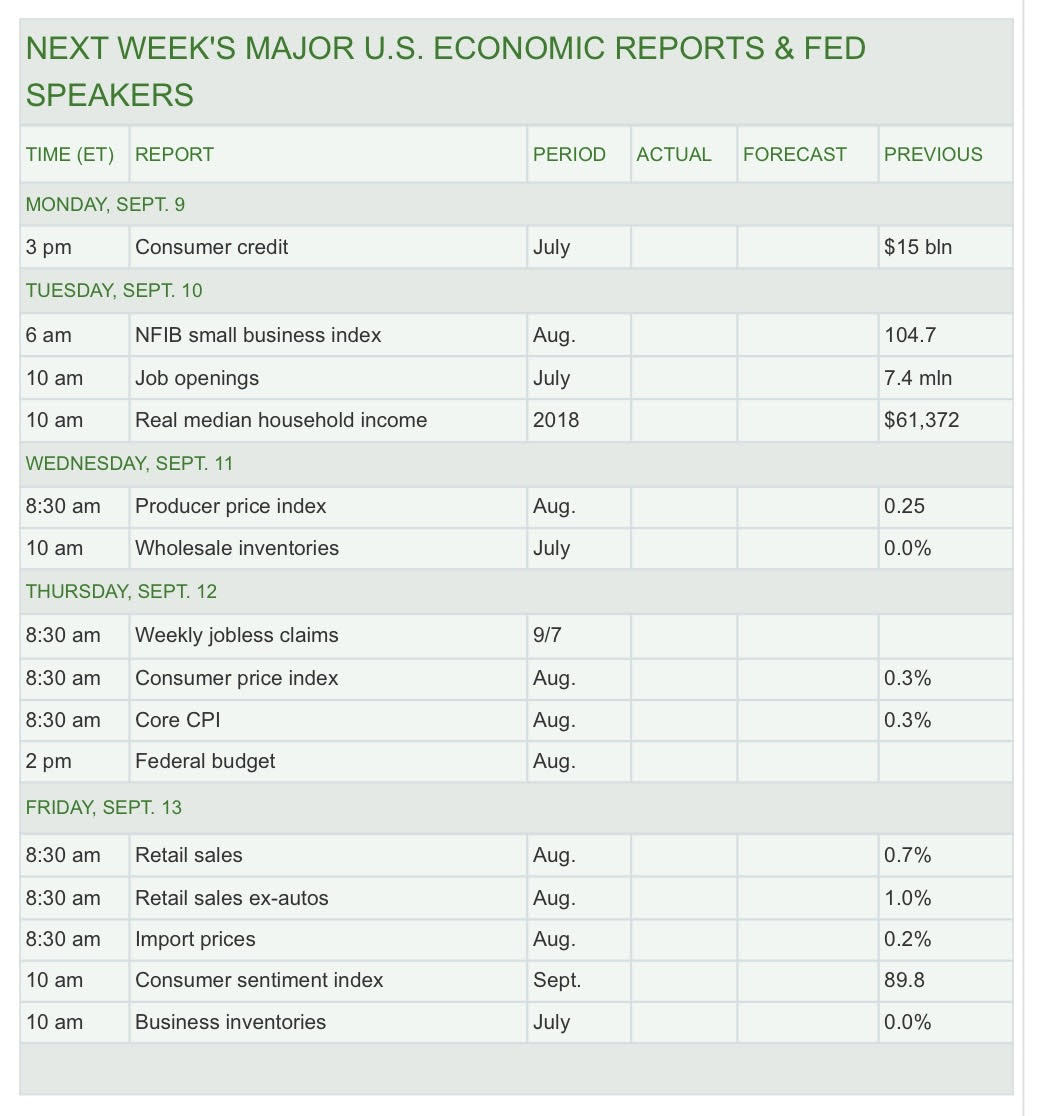
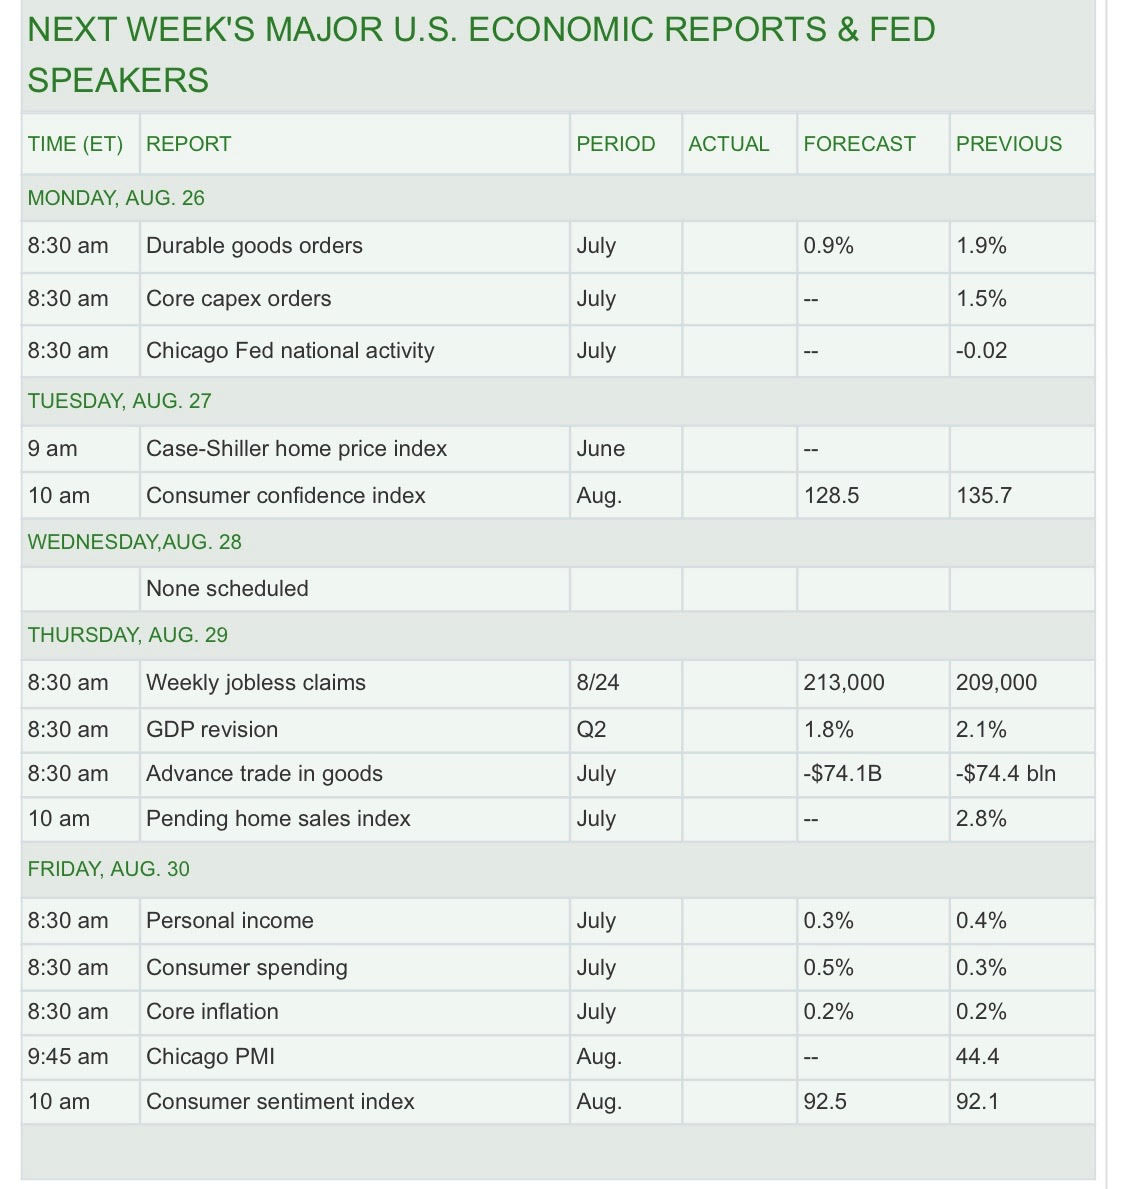
Taking a look at next week’s economic calendar the Bureau of Labor Statistics releases the monthly jobs report on Friday. This report includes how many jobs were created(or lost) during the month of August as well as how much the average take home pay increased.
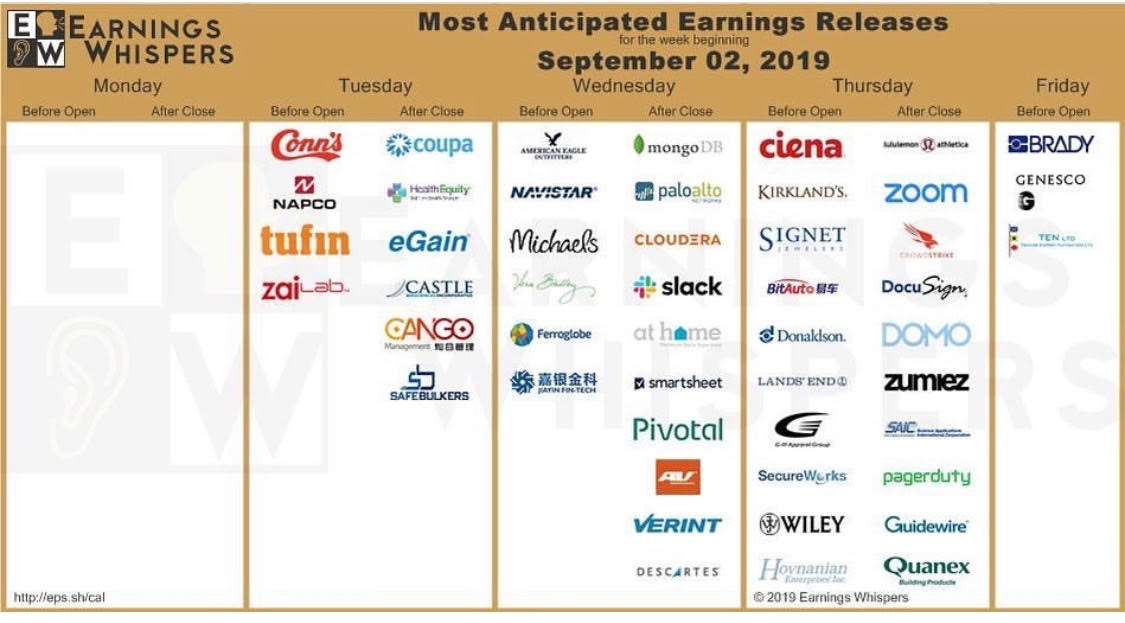
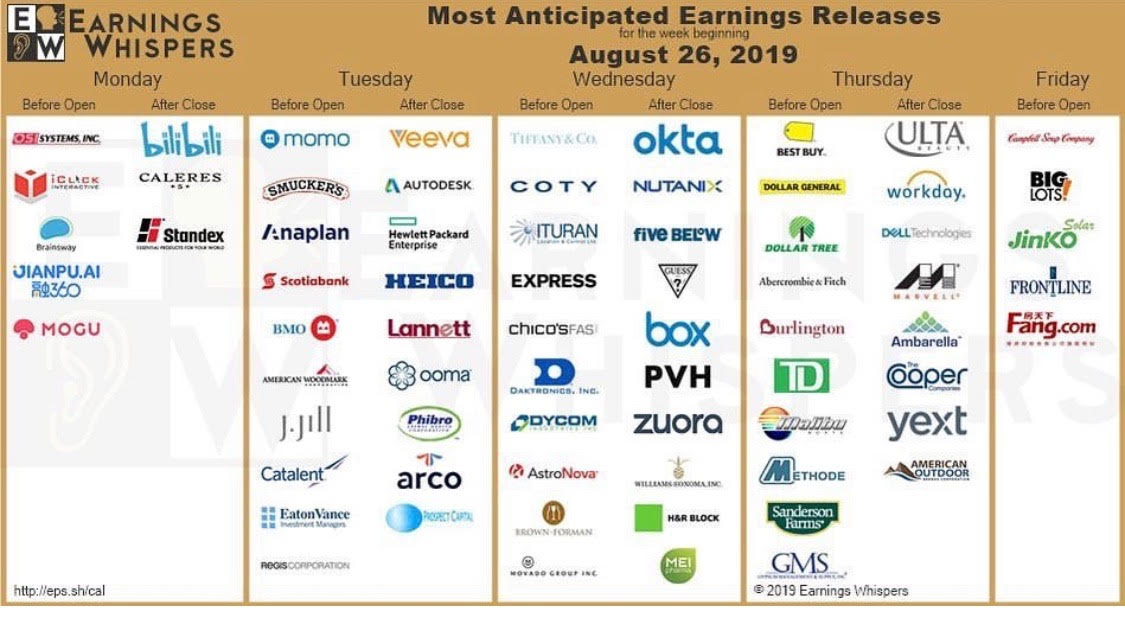
A very slow week of earnings this week as we will start to see more reports ramp up the second week of this month to kick off earnings season.
Word of the week:
Tariff- A tariff is a tax imposed by one country on the goods and services imported from another country.Tariffs are used to restrict imports by increasing the price of goods and services purchased from another country, making them less attractive to domestic consumers.
Please send me any comments, questions, or criticisms and as always, thank you for reading.
The Chinese yuan to U.S. Dollar conversion ratio rose to 7.10 over the weekend. China continues to devalue their currency in order to make their exports cheaper which drives more business to their economy by price competition. Currency devaluation has been China’s main tool of defense against President Trump’s tariffs. However China did announce on Friday that they would be tariffing 75 billion dollars worth of US goods 5-10%. In response, Trump raised the tariff on 300 billion dollars of Chinese goods from 25% to 30%.
PREVIEW
Personal income and consumer spending data comes out Friday morning. These numbers include changes in personal income, disposable income, and personal consumption expenditures. This will uncover nominal wage gains for the American consumer, a statistic that is closely monitored by the Fed.
Word of the week:
Capital Gain- Capital gain is a rise in the value of a capital asset (investment or real estate) that gives it a higher worth than the purchase price. The gain is not realized until the asset is sold. A capital gain may be short-term (one year or less) or long-term (more than one year) and must be claimed on income taxes.
Consumer Price Index(CPI) is the most frequently used statistics for gauging inflation. The data that came in Tuesday via the Bureau of Labor Statistics, was in line with expectations, and puts the US economy at a 1.8% inflation rate for 2019. This number is slightly below the Fed’s target 2.0% rate. The Fed can reduce the federal funds rate(currently 2.25%) to spur growth and inflation. As of today, Chicago Mercantile Exchange(CME group), suggests there is a 78.8% chance of a 25 basis point cut(0.25%) and a 21.2% chance of a 50 basis point cut on the September 18th FOMC.
Retail sales data is released by the US Census Bureau once a month. Retail sales increased 0.7% nearly doubling the expected 0.3%. Some notable statistics as compared to June’s numbers:
These numbers show that the US consumer is still in great shape and continues to spend. As mentioned in last week’s write up consumer spending accounts for 68% of the economy. Currently the 10% tariff on 300 billion of Chinese goods has yet to directly affect the consumer or at least enough to slow spending.
Yields:
US Treasury yields
3 Mo
2 Yr
10 Yr
20 Yr
30 Yr
08/01/19
2.07
1.73
1.9
2.21
2.44
08/02/19
2.06
1.72
1.86
2.16
2.39
08/05/19
2.05
1.59
1.75
2.07
2.3
08/06/19
2.05
1.6
1.73
2.03
2.25
08/07/19
2.02
1.59
1.71
2.01
2.22
08/08/19
2.02
1.62
1.72
2.02
2.25
08/09/19
2
1.63
1.74
2.03
2.26
08/12/19
2
1.58
1.65
1.92
2.14
08/13/19
2
1.66
1.68
1.94
2.15
08/14/19
1.96
1.58
1.59
1.84
2.03
08/15/19
1.91
1.48
1.52
1.8
1.98
08/16/19
1.87
1.48
1.55
1.82
2.01
2 Week Change
-.2
-.25
-.35
-.39
-0.43
Last week the flow of money into bonds continued. Yields fall as bonds are bought up, as yields fall, the value of the bond increases. With the current market volatility and fears of economic slowdown investors are seeking safer places to keep their money. When there is talk about a “CRAZY INVERTED YIELD CURVE,” this means that long term yields are lower than short term yields. The gap between the 2 year bond and 10 year bond is what the market pays most attention to. For a short period of time, no more than a few hours, the 10 year yield dropped below the 2 year yield on 8/14, inverting the yield curve. This same inversion happened in March of 2019 and we saw all three major US indexes drop about 2%. The Fed pays closer attention to the gap between the 3 month and 30 year yield. Looking at the chart above, the 30 year bonds yields have been dropping the fastest meaning more investors are seeking to put their money into long term bonds as opposed to short term, raising concerns about the condition of the market in the short term. The 30 year yield dropped below 2 on 8/15 for the first time in a long time. An inverted yield curve has signaled a recession within 6-18 months. The market rallies more than 15% on average in the 18 months following the inversion.
Market Performance:
Another volatile week determined by news headlines. Early in the week markets responded well to news that about half of the additional 10% tariffs on 300 billion of Chinese goods that were supposed to go into effect September 1st, were suspended until December 15th. Trump feared the tariffs on electronics including cellphones and laptops would hinder holiday shopping. Economic data released Wednesday on Germany and China indicated slowing growth. Investors piled into bonds, inverting the yield curve, sending dow down 800 points, its worst day of the year. Stocks rallied on Friday to recover some of the losses.
PREVIEW
Economic Calendar:
NEXT WEEK’S MAJOR U.S. ECONOMIC REPORTS & FED SPEAKERS
TIME (ET)
REPORT
PERIOD
FORECAST
PREVIOUS
MONDAY, AUG. 19
None scheduled
TUESDAY, AUG. 20
6 pm
Randal Quarles speaks
WEDNESDAY,AUG. 21
10 am
Existing home sales
July
5.39mln
5.27 mln
2 pm
FOMC minutes
THURSDAY, AUG. 22
8:30 am
Weekly jobless claims
8/17
216,000
220,000
10 am
Leading economic indicators
July
—
-0.3%
FRIDAY, AUG. 23
All day
Jackson Hole symposium
10 am
Jerome Powell speaks
10 am
New home sales
July
650,000
646,000
SATURDAY, AUG. 24
All day
Jackson Hole symposium
Next week’s lack of data release is made up for the annual Economic Symposium in Jackson Hole, WY. Each year since 1978, the Federal Reserve Bank of Kansas City has sponsored a symposium on an important economic issue facing the U.S. and world economies. Symposium participants include prominent central bankers, finance ministers, academics, and financial market participants from around the world. The participants convene to discuss the economic issues, implications, and policy options pertaining to the symposium topic. The symposium proceedings include papers, commentary, and discussion.
USD to Yuan Conversion:
In response to the tariffs President Trump has been imposing, China recently devalued their currency. Currency devaluations makes China’s exports cheaper. When they can offer cheaper products & materials than US companies, consumers as well as producers purchase more Chinese goods. For over a decade, China has kept its currency below the 7.0 USD to Yuan conversion ratio. Two weeks ago they crossed this line showing they are willing to self-inflict their own economy even if it brings down the rest of the world with them.
Economic Calendar:
Earnings season is starting to near its ends. A handful of retail companies report as well as home improvement giants, Home Depot & Lowes. Splunk and Salesforce are two large cloud computing companies, an industry that has been performing very well over the last few years.
Word of the week:
The price-to-earnings ratio (P/E ratio) is the ratio for valuing a company that measures its current share price relative to its per-share earnings (EPS). The price-to-earnings ratio is also sometimes known as the price multiple or the earnings multiple.
P/E ratios are used by investors and analysts to determine the relative value of a company’s shares in an apples-to-apples comparison. It can also be used to compare a company against its own historical record or to compare aggregate markets against one another or over time.
KEY TAKEAWAYS
Generally, a high P/E ratio means that investors are anticipating higher growth in the future.
The current average market P/E ratio is roughly 20 to 25 times earnings.
Companies that are losing money do not have a P/E ratio.
I’m going to be putting together a weekly market review & preview Sunday nights. I’m going to include information pertinent to the current economy for investors and traders alike. The first section will layout the week ahead’s economic calendar. Economic events provide details & date on market moving information. The two events I highlighted are the CPI and CSI. Consumer spending accounts for 68% of the US economy. However I don’t think this incoming data is going to move the equity markets all too much. As we have seen over the past few months, bad economic data actually spurred equity purchasing in hopes of a rate cut. I felt that it was important to include a section on US treasury yields. Last week we saw US(as well as global) yields drop a significant amount early in the week. Keep in mind when yields go down the value of bonds/treasuries goes up. Money has been moving out of stocks and into bonds/alternatives with rising fears of a global recession. The third section contains last week’s sector performance. The price of oil is absolutely plummeting. Also take note of the decline in transportation. Transportations are a good indicator of how the overall economy is doing. Finally the earnings calendar. There are quite a few large retail companies reporting which will give us a deeper look into how well the US consumer is doing. JD.com & Nvidia’s earnings will be key indicators on how the China tariffs are affecting businesses.
Economic Calendar:
TIME (ET)
REPORT
PERIOD
FORECAST
PREVIOUS
MONDAY, AUG. 12
2 pm
Federal budget
July
—
-$77 bln
TUESDAY, AUG. 13
6 am
NFIB small business index
July
—
103.3
8:30 am
Consumer price index
July
0.3%
0.1%
8:30 am
Core CPI
July
0.2%
0.3%
11 am
Household debt
Q2
WEDNESDAY,AUG. 14
8:30 am
Import price index, excluding fuel
July
—
-0.3%
THURSDAY, AUG. 15
8:30 am
Weekly jobless claims
8/10
215,000
209,000
8;30 am
Retail sales
July
0.4%
0.4%
8:30 am
Retail sales ex-autos
July
0.5%
0.4%
8:30 am
Productivity
Q2
1.5%
3.4%
8:30 am
Unit labor costs
Q2
2.7%
-1.6%
8:30 am
Empire state index
Aug.
—
4.3
8:30 am
Philly Fed index
Aug.
7.5
21.8
9:15 am
Industrial production
July
0.3%
0.0%
9:15 am
Manufacturing output
July
—
0.4%
9:15 am
Capacity utilization
July
78.0%
77.9%
10 am
Business inventories
June
—
0.3%
10 am
NAHB home builders index
Aug.
—
65
FRIDAY, AUG. 16
8:30 am
Housing starts
July
1.266mln
1.253mln
8:30 am
Building permits
July
1.290mln
1.220mln
10 am
Consumer sentiment index
Aug.
96.5
98.4
Yields:
US Treasury yields
3 Mo
2 Yr
5 Yr
10 Yr
20 Yr
30 Yr
08/01/19
2.07
1.73
1.68
1.9
2.21
2.44
08/02/19
2.06
1.72
1.66
1.86
2.16
2.39
08/05/19
2.05
1.59
1.55
1.75
2.07
2.3
08/06/19
2.05
1.6
1.53
1.73
2.03
2.25
08/07/19
2.02
1.59
1.52
1.71
2.01
2.22
08/08/19
2.02
1.62
1.54
1.72
2.02
2.25
08/09/19
2
1.63
1.57
1.74
2.03
2.26
Change
-.07
-.1
-.11
-.16
-.18
-.18
Market Sectors & Indices:
Earnings Calendar:
Word of the week:
Market Capitalization – Market capitalization refers to the total dollar market value of a company’s outstanding shares. Commonly referred to as “market cap,” it is calculated by multiplying a company’s shares outstanding by the current market price of one share. The investment community uses this figure to determine a company’s size, as opposed to using sales or total asset figures.
Earnings calendar provided by: Earnings Whispers
Economic calendar provided by MarketWatch
Market Sectors performance provided by The Wall Street Journal
US Treasury yields provided by The United States Treasury